HOW I TRACK MY PERSONAL FINANCES
The spreadsheet I use to track my finances
PERSONAL FINANCEPOPULAR
7/20/20247 min read
Hi readers,
today I want to share how I track my finances, as well as possible in my actual conditions.
I'm trying to remember if I've already told you what I'm using to track my personal net worth (from now on, NW): I use a spreadsheet in Google Sheets. This is a folder of sheets, each with a particular function, as you will read below.
If you want to use my own NW spreadsheet preset, it's available on this link: to use it you have to make a copy of it in your drive and after that, you will be able to use it however you like.
Let's start with this little guide/post about my spreadsheet. But firstly, I have to thank Mr. RIP, the man who created the spreadsheet which I got inspired by. He had already done a series, on his blog, talking about his method of managing finances, have a look at it.
OK, let's start. Firstly, when you open my NW spreadsheet preset, you see, in the lower part of the screen, a series of sheets:
2024: this sheet is completely automatically updated and it shows all the values, in the current year, of your NW, like your different account, or your net-flow, but we will talk about this below.
2024_TRANSACTION: this sheet contains all the transactions made in the current year, and it's the only sheet you have to manually update.
2024_CASH_FLOW: this sheet contains all the values about how much money you have earned and spent your money and in which category, in the current year.
2024_DASHBOARD: this sheet is used to show you, using graphs, different aspects of your money life in the current year.
NW_HISTORY: this sheet shows you how your NW is growing (or reducing) during all the time you've tracked your finances
NW_HISTORY_by_ASSET: this sheet is present only in my own spreadsheet, and it analyses how every asset of my net worth, affects his value.
EXPENSES: this sheet shows you how you've spent your money during all the time you've tracked your finances
INCOME: this sheet shows you how you've earned your money during all the time you've tracked your finances
INCOME&EXPENSES: this sheet is present only in my own spreadsheet and not in the preset one. I use it to analyse the evolution of my total expenses and incomes.
SETTINGS: this sheet contains all the essential variables for the proper operation of the spreadsheet
2024
Every row has in its columns these different values:
Name of what's tracked in that row
The value of the asset at the end of the previous year, in pink (of course if it's the first year you use this spreadsheet, you're not going to see the values of the previous year).
The values of the asset in the months of the current year (in blue)
The newest value of the current year, in pink
This sheet can be divided, as you can see it's already divided, into three parts:
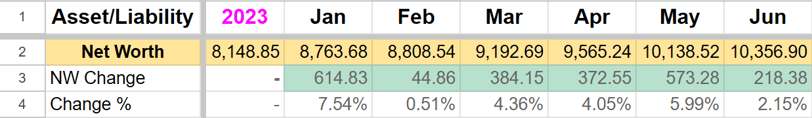
Net Worth
This part contains all the values of your Net Worth value, in the first row. Under this one, there are two lines which show the change of your NW compared to the previous month: the first one shows the absolute change, and the second one the percentage change. Thanks to conditional formatting you can see clearly if your NW has lost or gained values compared to the other months.
Account
This part contains all the different accounts you have, like bank accounts, cash, stocks, bonds, crypto and so on. In my spreadsheet, all the values are automatically updated with some not-very-simple formulas, so if you make any changes from the preset, pay attention to fixing the formulas.
Cash flow
This part is a simpler way to see what the "CASH_FLOW" sheet shows. Here I put only the values of income and expenses to see if I'm saving some money or spending all of them. Thanks to other formulas I added a row to see how much money I save every month (income - expenses) and which is the saving rate compared to the income (savings/income in percentage).
2024 TRANSACTION
Every row of this sheet it's a movement of your money, it's the same if you are spending, earning or transferring that money, they are moving to other positions so you have to track that operation. This is the sheet which you will work with more because it's the only sheet where you have to add values. When you update this sheet, the other ones update themselves automatically.
As you've seen in the image, you have different values to insert in this sheet for each transaction you made. Let's analyse them:
Month: you have to insert the number of the month when the transaction is made. This value is used to update the values of your accounts by month.
Day: you have to insert the number of the day when the transaction is made
Description: here is the place where you describe what that transaction is, as a reminder for the future
Import: you have to insert how much money are you using in that transaction. If you're spending them you have to insert negative values, instead if you're earning them you have to put positive values. If you have to transfer your money to a savings account, you have to put negative values, because I wrote formulas in that way.
Category: here you have to select the category of your transaction. If you're transferring the money to a savings account, you have to use the "Transfer" category: the formulas will do all by themselves so that the values of the two accounts used update automatically.
Method: which account are you using in that transaction. The savings account isn't allowed.
From/To: when you are transferring your money, you have to insert here where the money is entering and in the previous column ("Method" one) where it's going out.
2024 CASH FLOW
This sheet contains all the values divided by month and by category. Here you can see how you're spending/earning your money and in which category. It's useful to know if you're spending more money than you want in some categories.
2024 DASHBOARD
This sheet contains some graphs you can use to understand better your financial situation.
Which graphs are there?
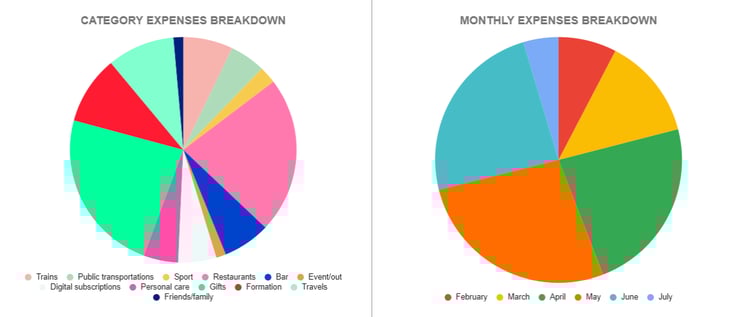
Monthly expenses breakdown: a pie chart which shows the total amount of expenses by month
Category expenses breakdown: a pie chart which shows the yearly amount of expenses by category
Income and Expenses: a bar chart which shows the amount of expenses and income by month
Expenses line graph: a line graph which shows the expenses by the different categories
Expenses area graph: an area graph which shows the expenses by the different categories, also showing the total amount of expenses per month
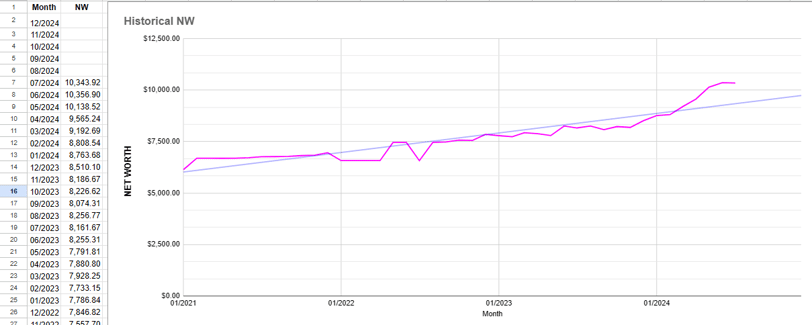
NW History
This sheet shows the evolution of your NW during this time. If you're using this spreadsheet for the first time, you can only see the current year's evolution.
The values have to be updated manually every month, adding a row. A very simple task!
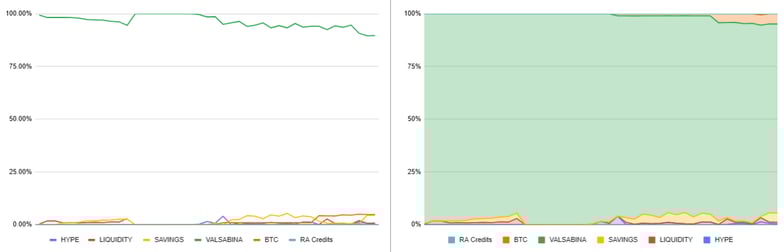
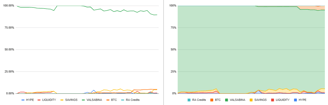
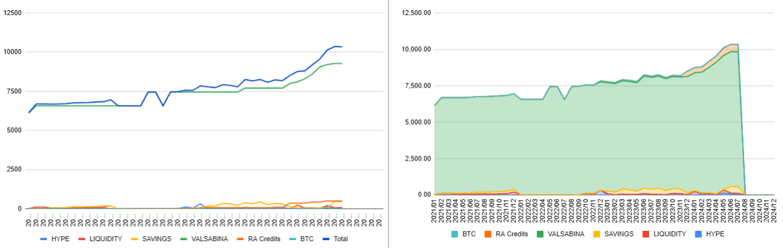
NW History by Asset
This sheet shows the evolution of the NW, as in the previous sheet, but, this time, I prefer to divide it in the different assets I own (account, savings, crypto and credits) to see better which asset affects my NW more.
These data are used to create four different graphs. The first two show the evolution of my NW in absolute terms, on absolute (LEFT) and relative (RIGHT) scales. The same is shown in the second two, but they use relative data.
Income - Expense sheets
This sheet shows all the income/expense values at the time. You have to update than manually every month by watching the Cash Flow sheet and the graphs will update automatically. In both sheets there are the same graphs:
Line graph: a line graph which shows the expenses/income by the different categories
Area graph: an area graph which shows the expenses/income by the different categories, also showing the total amount of expenses per month
Category breakdown: a pie chart which shows the amount of expenses/income by category
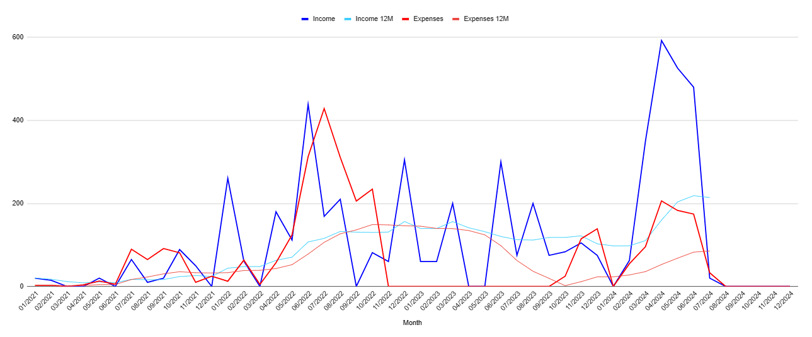
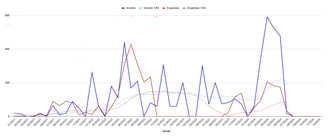
Income & Expenses
This sheet, which, as I've told you before, is present only in my own version of the spreadsheet, tracks the evolution of my income and expenses, also showing their moving averages.
Settings
This sheet contains all the variables used in the spreadsheet. If you want to change something, pay attention if everything, after the changes, works.
Between the "Income&Expenses" sheet and the "Settings" one, there are other sheets, like the "2024" one, which contains all the data of the past years, since 2021 2006 (yeah I found the files which contain the value of my NW when I was 1 year old!) when I seriously started tracking my finances.
I hope you've enjoyed this reading about my spreadsheet, I hope you will use my preset.
I'm writing a new post about my financial plan, so stay tuned for it.
See you soon with more content